Here are some early implementations of the Lotus Chart, in the fields of coin trading, music discovery, inventory control, and epidemiology.
Cryptocurrency Trends – Dynamic Data Visualization
Music Discovery – Dynamic Data Visualization
Inventory Control and Management Demo
S&P 500 – Snapshot – March 6, 2024
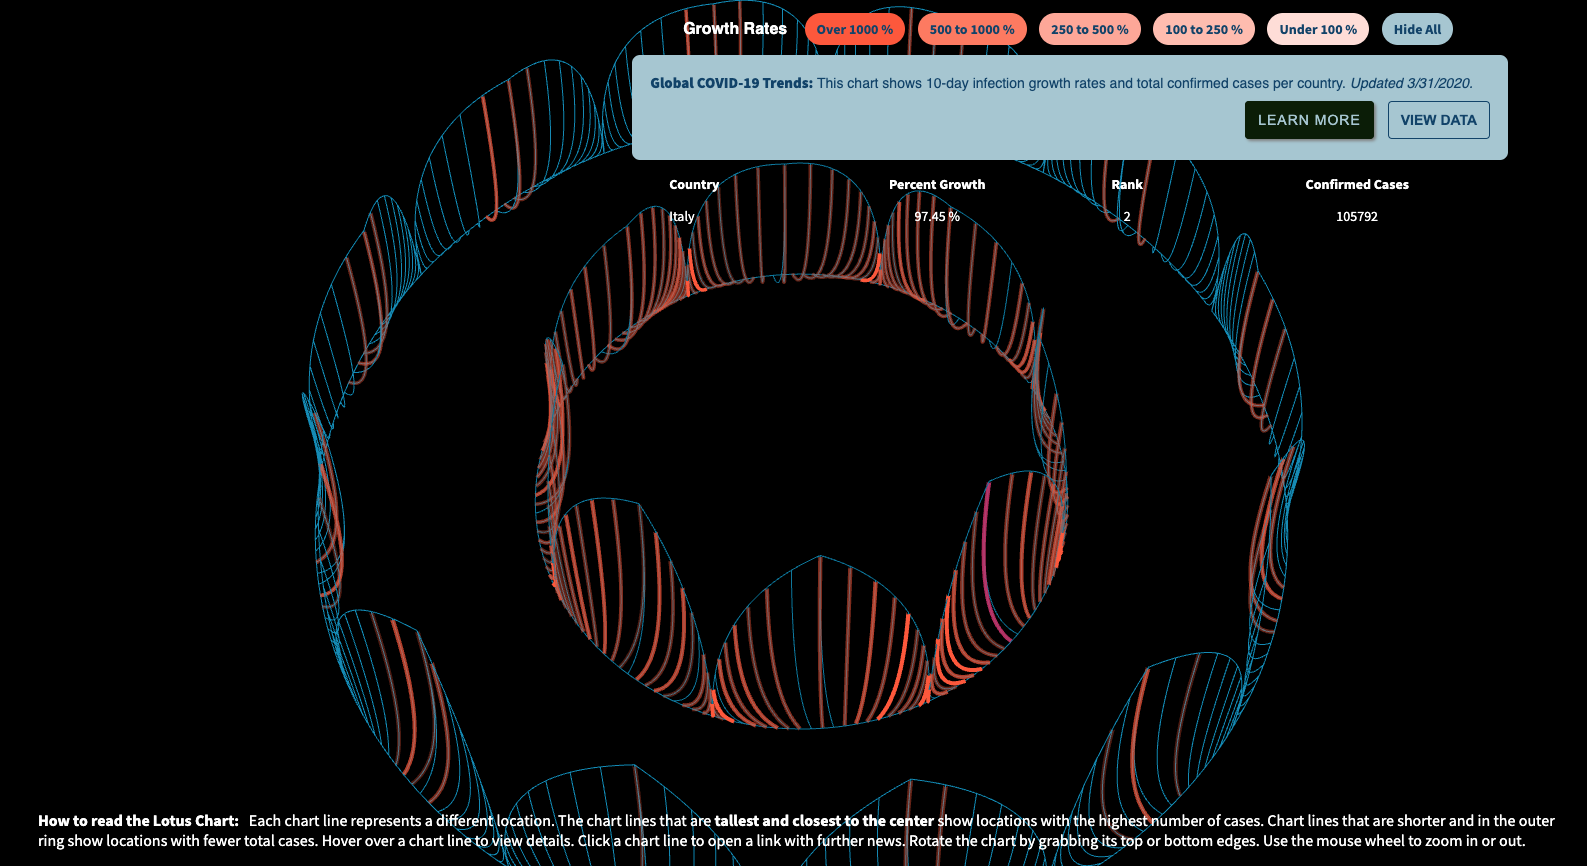
Global Pandemic Trends – Snapshot – March 2020
USA Pandemic Trends – Snapshot – April 2020
Full presentation (video and slides) available from https://sociallinuxexpo.org.
Source code available for download on GitHub.