Lotus.fm builds dynamic, data-driven applications in the spaces of philanthropy, content discovery, and finance.
Lotus Insight
Visit my financial news and opinion blog at lotusinsight.substack.com. Subscriptions are free, for the moment.
Interactive Data Visualization
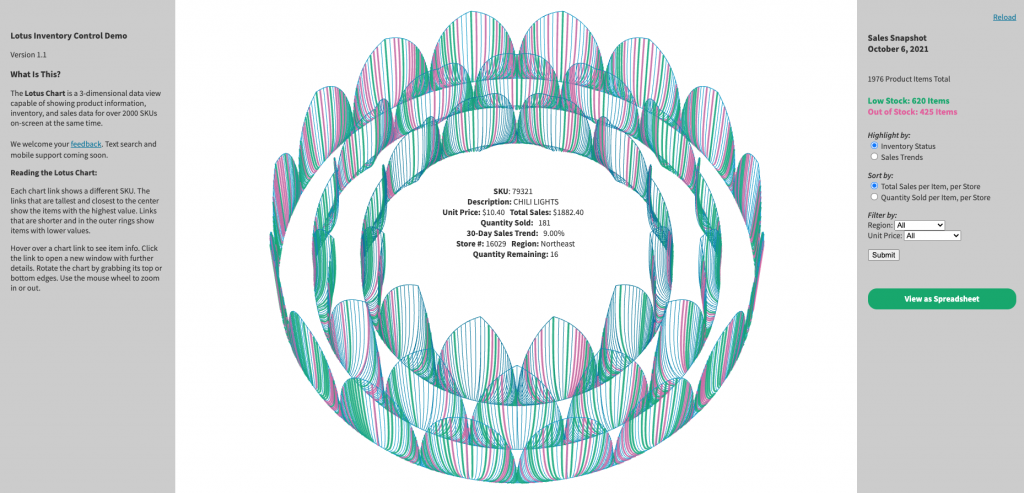
The Lotus Chart is an interactive, 3-dimensional data view enabling rapid preview and assessment of a full data ecosystem, with context and metadata. The chart has applications in finance, scientific literacy, and media discovery. See the Lotus Chart in action.
Important Announcement
The Lotus Chart is now licensed under the Creative Commons Attribution-NonCommercial-ShareAlike 4.0 International license.
Our public repository is live on GitHub. What this means is that you are free to download the code and/or adapt it for non-commercial and educational purposes. This new license does permit commercial uses of the source code… with permission. We welcome contributors and collaborators. If you would like to use the source code for a for-profit project, please contact us to discuss terms and pricing.
Further background available from Creative Commons here.
Technical Analysis
This video captures a real-time, “birds eye view” of the U.S. Stock Market, showing active growth trends and securities metadata for 2000 US ticker symbols at one time. Similar live, interactive, and customizable charts are available for Russell 1K, Russell 2K, and S&P 500.
Please inquire for pricing.
SCaLE 18x Presentation on Parametric Geometry
I am excited to announce that Lotus.fm LLC is growing and that I am returning to work full-time at the company as part of our founding team. This video is an oldie-but-goodie. All the same it does a decent job explaining our core IP.
Tess Gadwa
Product Architect, Lotus.fm