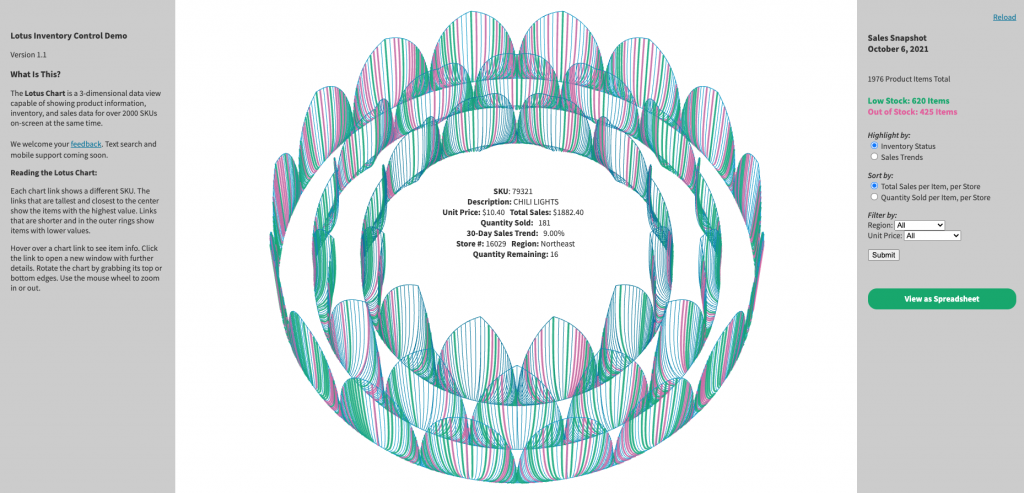
The Lotus Chart is an interactive, 3-dimensional data view enabling rapid preview and assessment of a full data ecosystem, with context and metadata. The chart has applications in finance, scientific literacy, and media discovery. See the Lotus Chart in action.