Lotus Insight
Visit my financial news and opinion blog at lotusinsight.substack.com. Subscriptions are free, for the moment.
Interactive Data Visualization
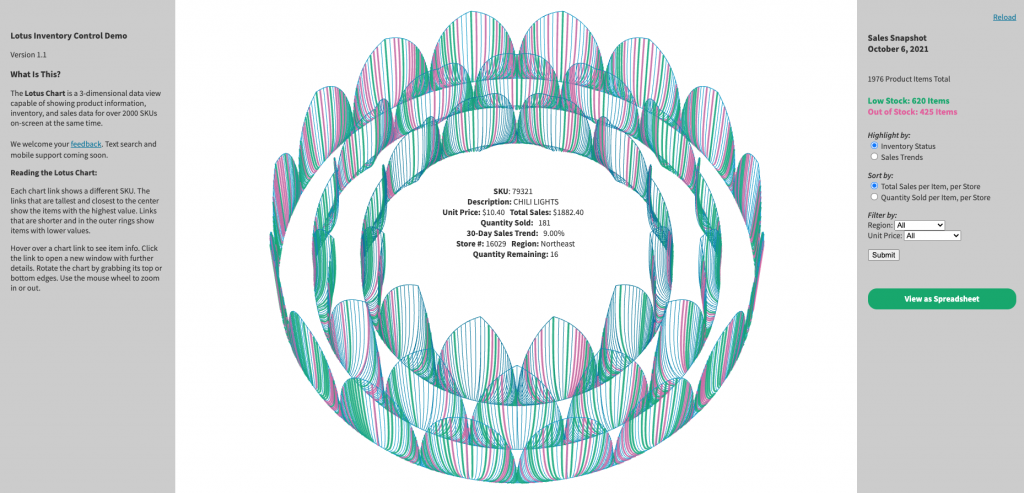
The Lotus Chart is an interactive, 3-dimensional data view enabling rapid preview and assessment of a full data ecosystem, with context and metadata. The chart has applications in finance, scientific literacy, and media discovery. See the Lotus Chart in action.
Important Announcement
The Lotus Chart is now licensed under the Creative Commons Attribution-NonCommercial-ShareAlike 4.0 International license.
Our public repository is live on GitHub. What this means is that you are free to download the code and/or adapt it for non-commercial and educational purposes. This new license does permit commercial uses of the source code… with permission. We welcome contributors and collaborators. If you would like to use the source code for a for-profit project, please contact us to discuss terms and pricing.
Further background available from Creative Commons here.
Technical Analysis
This video captures a real-time, “birds eye view” of the U.S. Stock Market, showing active growth trends and securities metadata for 2000 US ticker symbols at one time. Similar live, interactive, and customizable charts are available for Russell 1K, Russell 2K, and S&P 500.
Please inquire for pricing.
SCaLE 18x Presentation on Parametric Geometry
I am excited to announce that Lotus.fm LLC is growing and that I am returning to work full-time at the company as part of our founding team. This video is an oldie-but-goodie. All the same it does a decent job explaining our core IP.
Tess Gadwa
Product Architect, Lotus.fm
Trade Responsibly.
Bitcoin prices are heating up again and so is the planet. You may be curious about how much of the hype is true. Is cryptocurrency really a major carbon offender? How do the different coins stack up?
We decided to release a sneak preview of the Lotus Trader software suite ahead of schedule, to give greater insight into these issues. This market trends visualization shows market values for 2058 cryptocurrencies in real time. It also gives you tools to quickly and easily offset your carbon cost. We will be adding further resources and updates throughout the fall.
Giving Map Animated Time Lapse PSA Goes Viral
Between November 25 (the Wednesday before Thanksgiving) and December 15, 2020, Lotus.fm’s series of time lapse infographics on the spread of COVID-19 went viral on social media, reaching an estimated 6.2 million online viewers with more than 10,000 shares across Facebook and Twitter. These animated 4D data visualizations show cases and deaths from Coronavirus during Fall 2020.
US coronavirus surge since October 2020. #MaskUp folks.
We haven’t even seen the worst yet. We are so damn screwed. #COVID19 pic.twitter.com/98j7UETOMU
— Eric Feigl-Ding (@DrEricDing) December 4, 2020
Knowing that holiday travel and gatherings could be a dangerous vector for the virus to spread, we worked hard to reach influencers and get the word out among our base. We believe that data science can change the world and save lives.
Lotus.fm produced these visualizations as Public Service Announcements to accompany the Giving Map: our ongoing initiative for grassroots philanthropy in the areas of the US hardest hit by the pandemic. The PSA animations are available for download and reuse in GIF and MP4 formats, under a Creative Commons license. Please contact us if you require a different resolution or format, or would like to request a time lapse for a specific time period or geographic area.
Actionable Data
Just published in The Startup—“Actionable Data: Where Design and Data Science Converge.”
“What actionable data does is take a measurable, quantifiable data set and connect it to specific calls to action. In essence, it presents you with new information and instead of leaving you to mull (or stew) it provides you with ways to respond. The goal is always to empower users.”

Giving Map Featured on CloudBees Podcast
“What if you could donate to a nonprofit whose boots are on the ground right where they’re most needed this week?”
On August 27, Lotus.fm was featured on the Software Agents podcast from Cloudbees.
Lotus.fm to Present at SCALE on March 8, 2020
We have been selected to speak at the Southern California Linux Expo (SCALE) in Los Angeles on Sunday, March 8. Our topic:
Discovery without Marketing. In the digital age we have lost something: the experience of browsing in a vast record shop or bookstore, discovering intriguing choices next to familiar ones. We are inundated by information, but most remains unseen. Lotus Petal Architecture reveals this invisible information.